DEVELOPMENT SNAPSHOT #55 — Researching Facility Productivity: Six Production Paths, Measured Output
Contributed by: Takeshi Miyaoka on Thursday, October 15 2026
Last modified on Thursday, October 15 2026
In #54, we followed how people are allocated across occupations and regions. This time, we look at the places where they work: research that improves facility production capacity. One distinction matters from the start: research raises a facility’s capacity; it does not promise the same percentage increase in daily output.
Quick summary
• Six paths: agriculture, aquaculture, mining and gathering, livestock, processing, and water intake.
• The first research takes 15 days and costs 0.25 ARC per day (3.75 ARC total).
• Completion raises the target facilities’ production capacity by 10% over baseline; continued research is capped at +30%.
• Staffing capacity is unchanged. Actual output still depends on materials, workers, operating conditions, and market demand.
Six paths, one at a time
The Industry branch of Technology Development contains research for agriculture, aquaculture, mining/gathering, livestock, processing, and water intake. These are captures from the actual Debug build’s Research Management screen. Cards show duration and budget; the right-hand detail pane describes the target facilities and effect. The first image shows agriculture and aquaculture side by side: the same capacity bonus applies to different facilities.
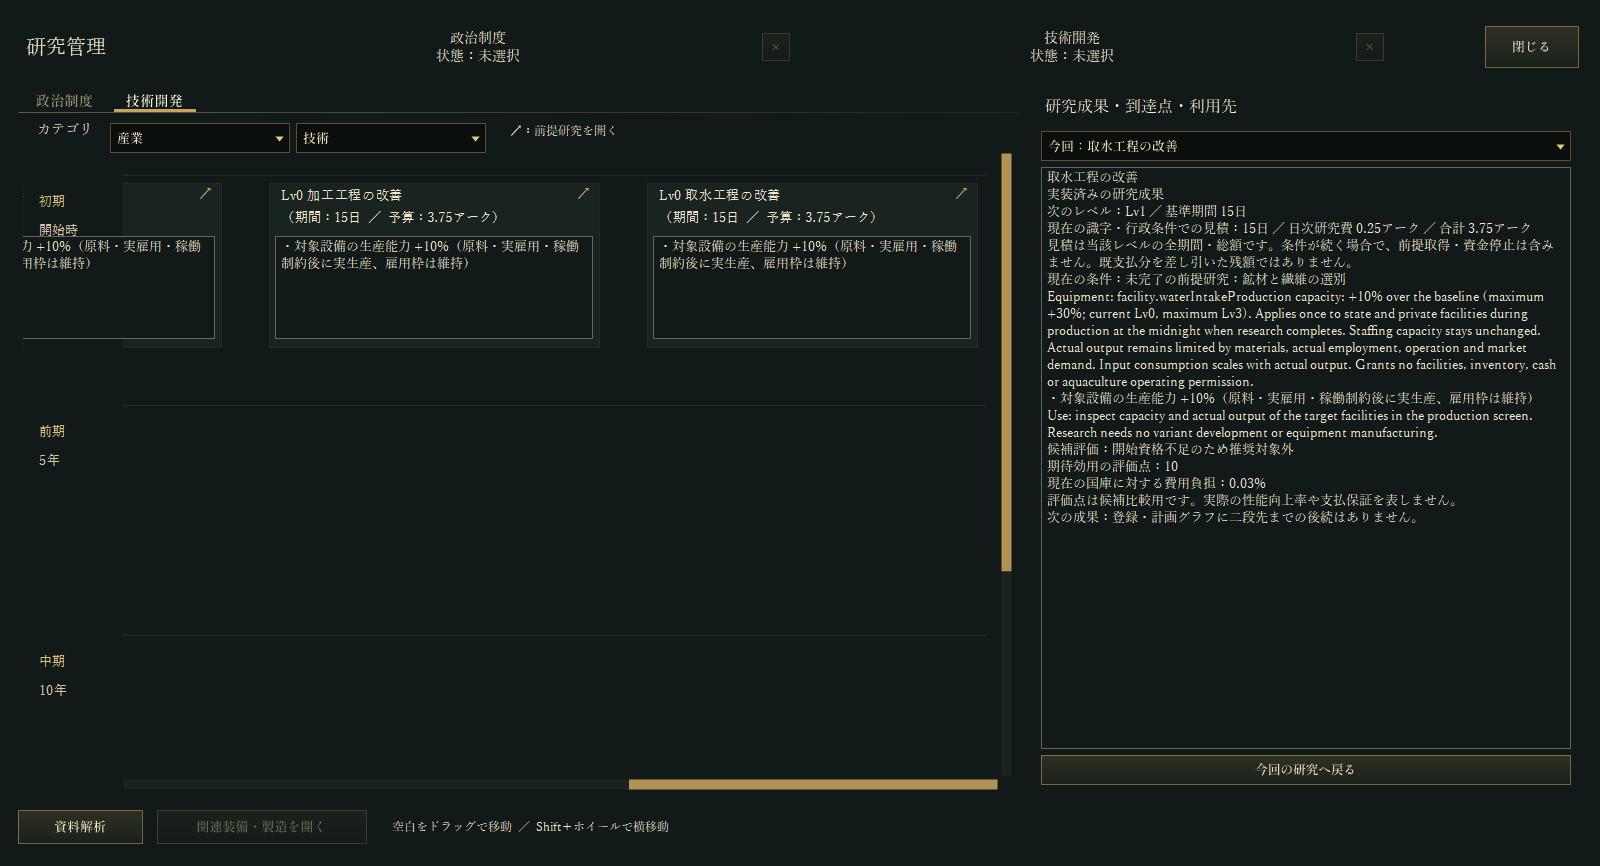
Research progresses through the daily simulation and applies to the country’s target facilities when it completes. It does not construct facilities or add workers, and completion does not create inventory or cash. Production still runs through the normal facility process, with its existing material, employment, operating, and demand limits.
+10% capacity is not +10% output
To measure the difference, I ran a 30-day economy comparison using the same country conditions. Water intake without research produced 73,325; with water-intake research it produced 74,657. That is 1,332 more, or about 1.8%. The research definition raises capacity by 10%, while the measured output difference was about 1.8%—because the operating conditions do not always allow every facility to use all of its capacity.
The screenshot below is the Water Intake research detail pane, not the output report; the +1.8% figure above comes from a separate matched 30-day economy run.
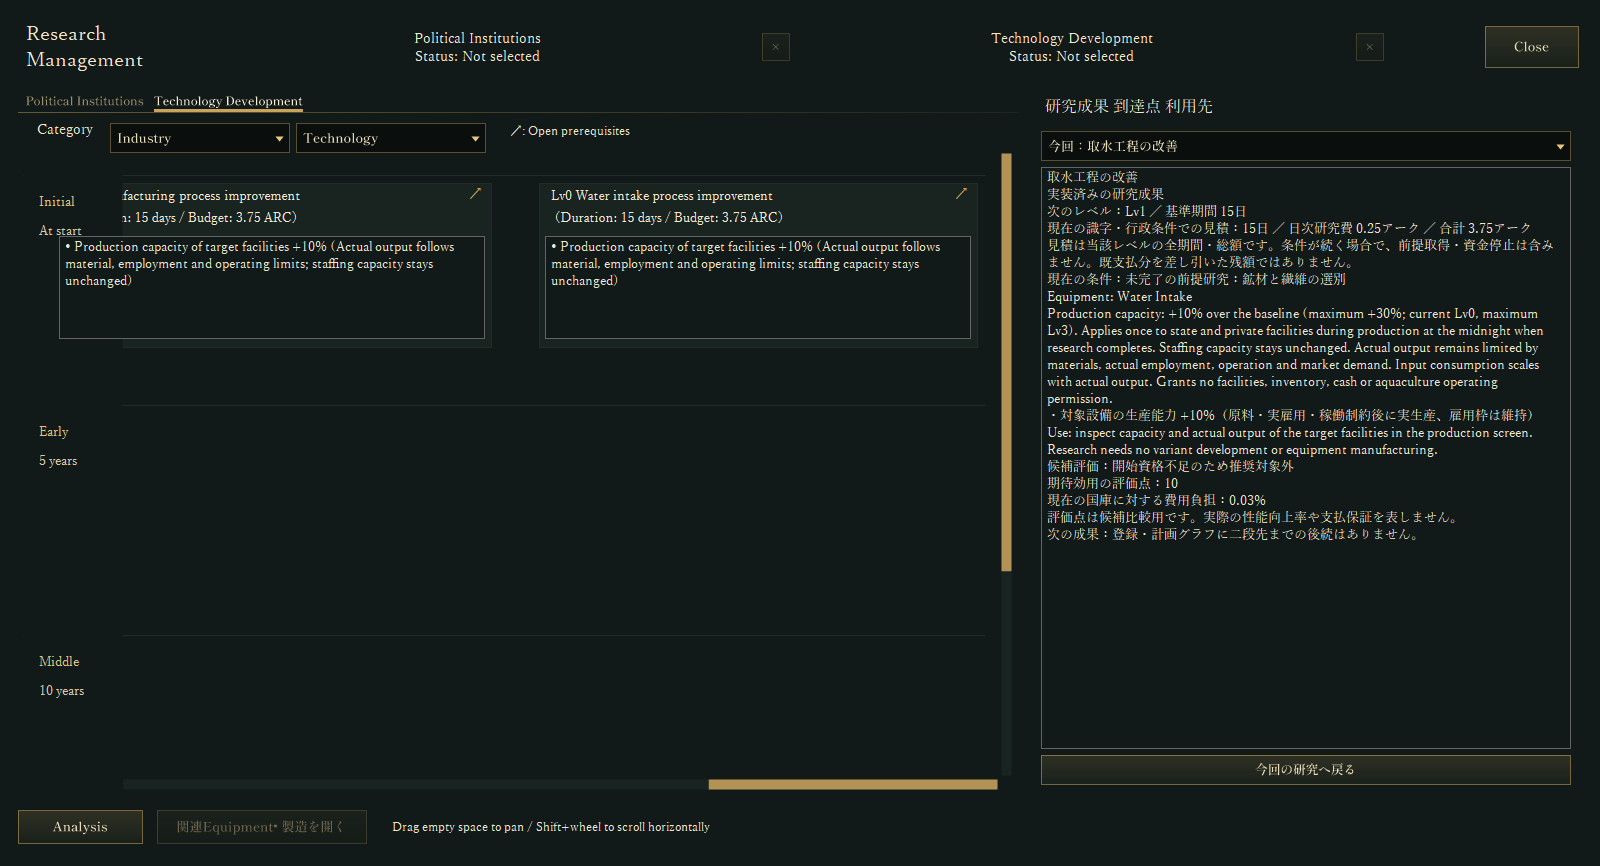
This is one result from a specific save and a 30-day run, not a fixed outcome for every country, facility, or period. Population and workforce conditions were held comparable in this test. We have not established that paying for research always increases tax receipts or profit. To judge its value, compare both the capacity and the actual output/material use in the production view.
Agriculture and aquaculture have different targets
For example, agriculture research applies to farms, orchards, and cultivation farms; aquaculture research applies to aquaculture farms. Capacity can rise in steps as research advances, but the staffing allowance remains unchanged. If workers or inputs are short—or a facility is inactive—the realized output need not rise along with its capacity.
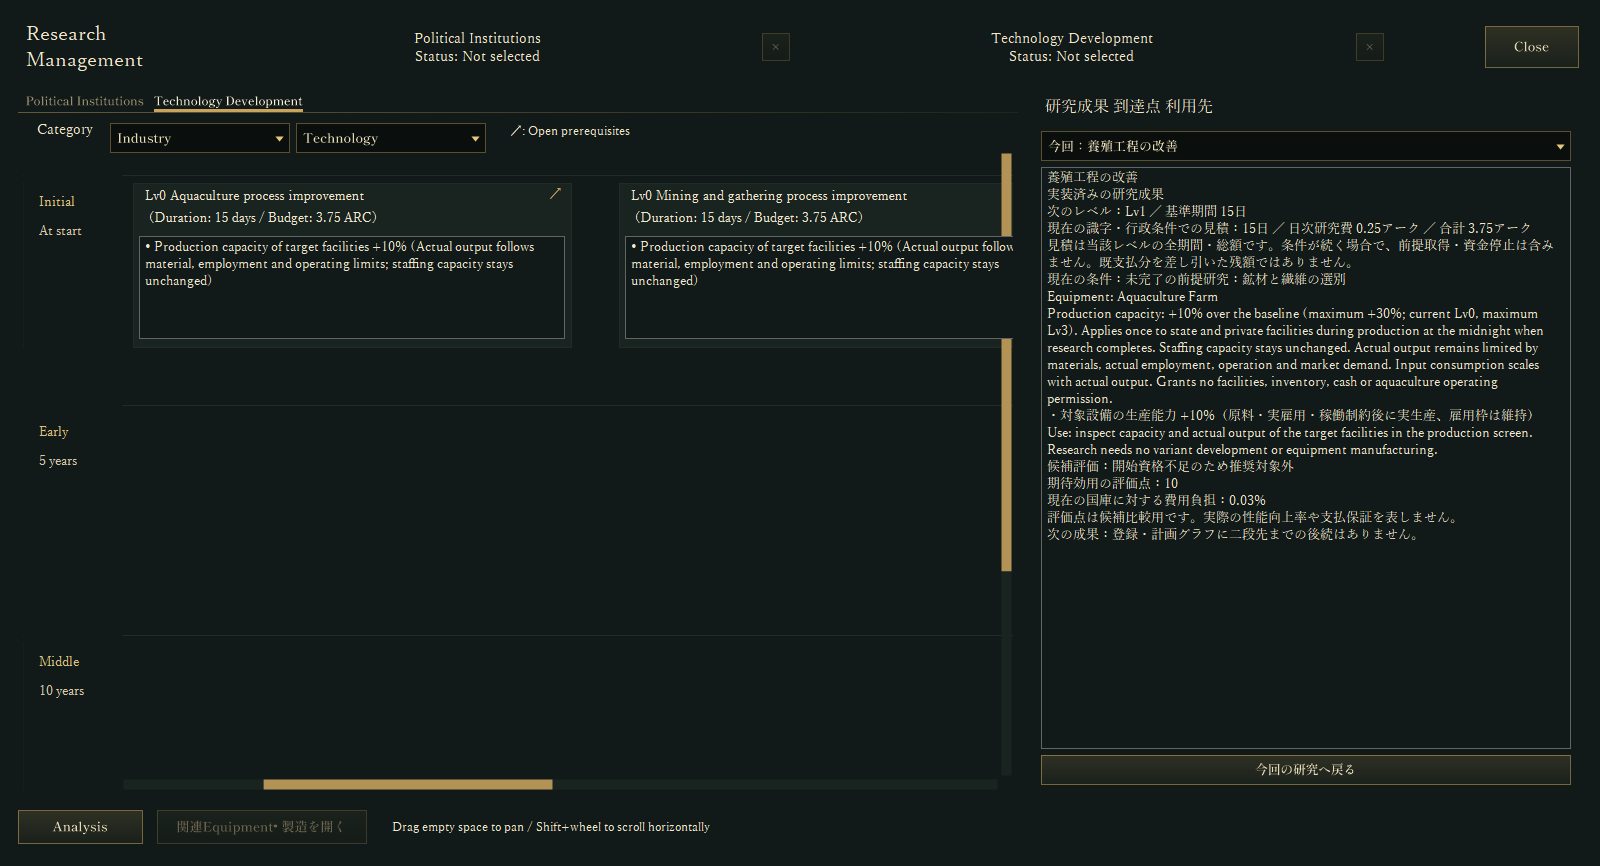
The screenshots show the real research cards and their detail pane. There is no need to fund all six paths at once: this is a way to examine the process that is actually constrained in your current situation.
What this snapshot verifies
We can verify the displayed research duration, cost, target facilities, capacity increase, and the path by which completed research affects normal facility production. The gap between capacity and output depends on conditions, and a positive return on investment is not guaranteed. A useful next check is to compare a facility’s capacity with its realized output before and after the research completes.
For the previous step, read DEVELOPMENT SNAPSHOT #54. You can explore the current build on the Downloads page, or see ways to support the game.