
Small Development Detail: Reading a City Through One Line
- Friday, August 21 2026
- Contributed by: Takeshi Miyaoka
- Views: 88
DEVELOPER BLOG #04
In one quiet corner of the great map, even a single water intake facility is building a history of its own. This time, we step away from the full screen and look closely at one small line: wage history.
One line carries the time of working people
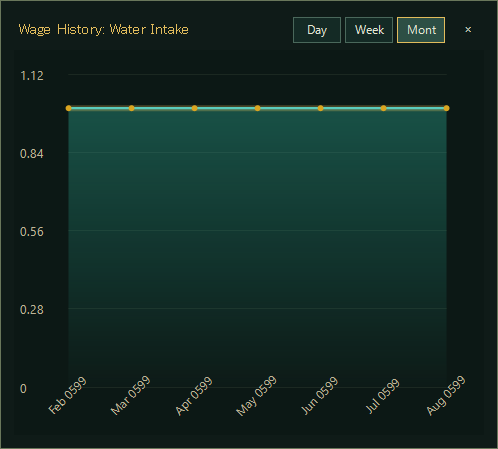
The wage shown in a facility panel is more than a current number. Switch between day, week, and month views, and seven recorded points begin to reveal the time that facility has lived through.
Even a flat line has a story
In this capture, the line travels quietly across the chart. That does not mean nothing is happening. It marks a brief period of balance, when labor needs are being met and production and employment have found a steady rhythm.
If resources run short, a transport route breaks, or nearby facilities begin competing for workers, that calm line can change. A single rise may tell you that the movement of people or goods has shifted somewhere in the city. We want this small chart to become an early doorway into the larger changes moving through the world.
Day
Follow the last seven days closely and spot sudden shortages or recoveries.
Week
Smooth the smallest fluctuations and read the direction of local employment.
Month
Look back across a longer span to see how a facility and its regional economy have changed.
Open in place
Select the wage value and the chart slides into the facility panel, keeping the return to map decisions immediate.
Finding everyday life behind the numbers
In Ashwind Chronicle, decisions as large as a national budget or a border are connected to the lives of people working in a single facility. Before a dramatic battle, there may be a quiet movement in a chart. Noticing that sign and deciding what it means is another kind of adventure.