
DEVELOPMENT SNAPSHOT #53 — A Population That Ages: Five-Year Cohorts, Births, and Deaths
- Tuesday, October 13 2026
- Contributed by: Takeshi Miyaoka
- Views: 22
Reading the population through Debug screens
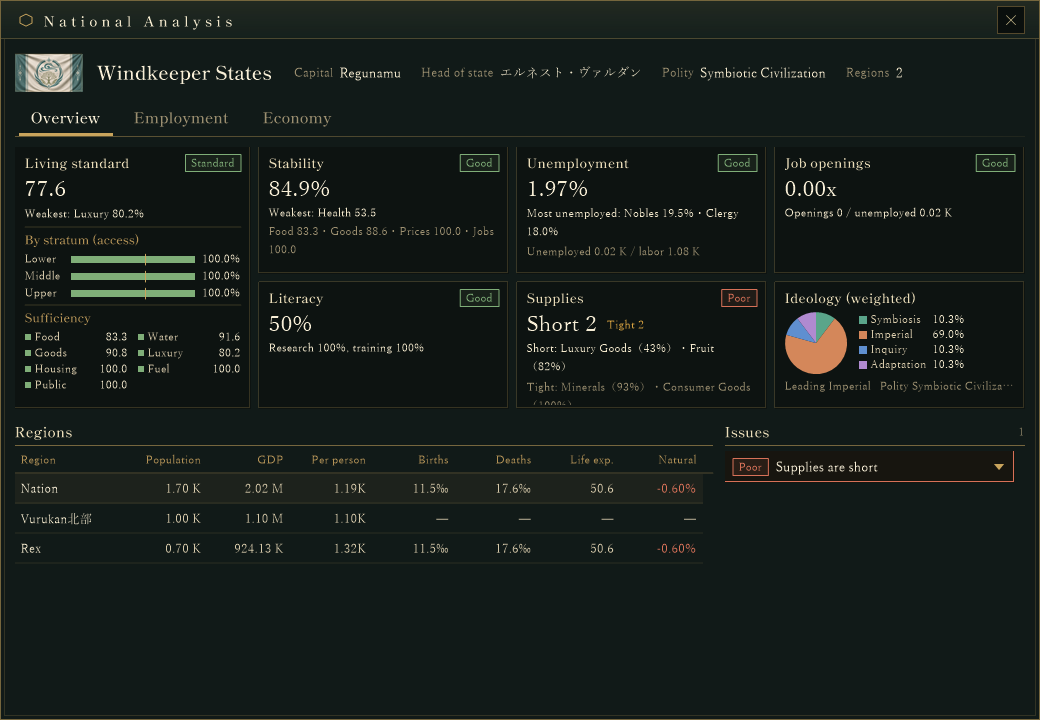
An age breakdown reveals differences hidden by a single “population up or down” figure. The thickness of working-age cohorts also connects to the labor force and occupation mix. As births and deaths accumulate, that shape changes over time.
Ageing one month at a time, without losing fractions
Population is represented in five-year age cohorts. Each month, 1/60 of a cohort is eligible to move into the next one. Rounding down every month would discard small fractions, so the number of people who move is resolved in whole people, while the fractional remainder is stored per cohort as AgeingRemainder and carried into the next month. The display unit K means one person is 0.001K. This preserves small changes and keeps cohort totals coherent over long runs.
Keeping births, deaths, and life expectancy distinct
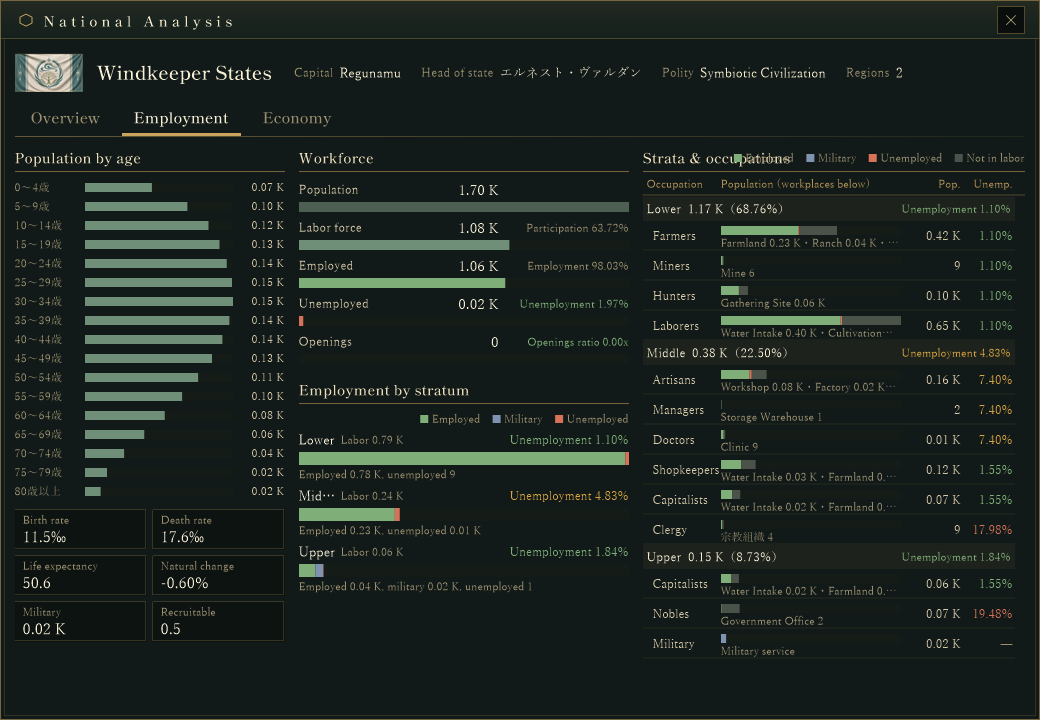
Monthly updates calculate births and deaths separately. Birth and death rates are regional values; age-specific mortality rates build a life table from which average life expectancy is calculated. Natural change is the difference between births and deaths. Migration, war, and disasters remain separate causes, making it easier to trace why a population changed.
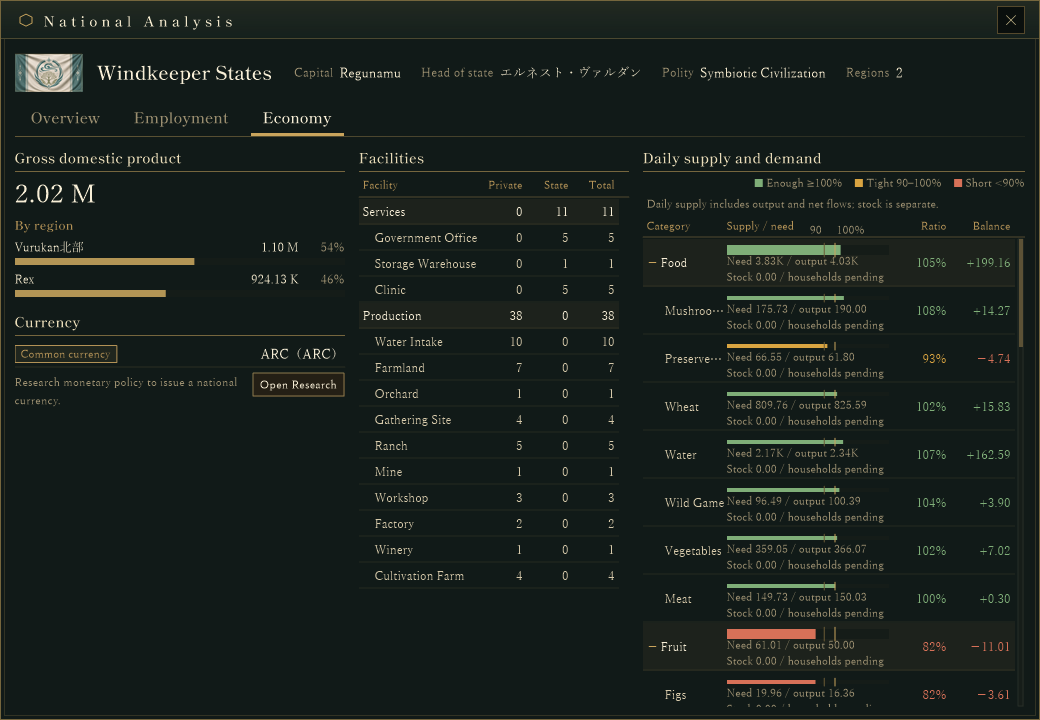
The Debug view lets us inspect regional conditions and mortality alongside cohort counts. The next screen is from the same test save and shows its economy and regional issues, placing population values beside living and production conditions.
What is implemented—and what is still being tested
Age cohorts, monthly fractional carry, and separate birth/death updates are represented in the current specification and implementation. The figures in these images are snapshots from one test save, not a forecast or final balance. We are continuing to check whether population changes remain consistent over long runs while regional conditions and living standards vary.
In Snapshot #52 — Seasonal Weather, we explored regional climate. This time, we follow how people’s age structure changes as the months pass.
Explore the game downloads or read the Japanese version.