
DEVELOPMENT SNAPSHOT #116 — What a Facility Makes, at a Glance: The Output Donut
- Sunday, November 22 2026
- Contributed by: Takeshi Miyaoka
- Views: 18
In the Facilities screen (the nationwide facility view introduced in #104), selecting a facility shows what that facility type produces across the whole country each day in the Outputs & allocation panel. On November 18, this panel was rebuilt from a table of numbers into a donut chart with a legend. Over November 20 and 21 it was refined further: the chart heights, the number of legend rows and their type size, and highlighting when the mouse is over the chart.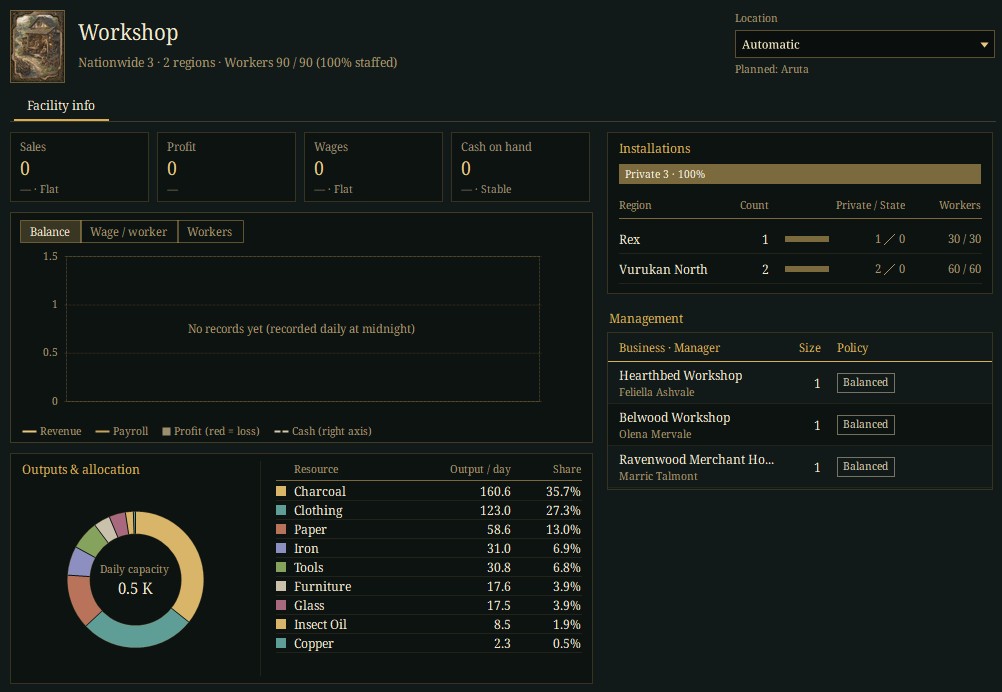
Workshop selected in the facility list (the facility info part, cropped from an actual Debug-build screen). The Outputs & allocation panel is at the lower left.
1. Shares as slices, daily capacity in the middleEach slice of the donut is that facility type's share of nationwide output per day. The middle of the ring shows the daily capacity in thousands (K); for workshops it is 0.5 K. The legend on the right lists a swatch in the slice colour, the resource, output per day and share, in descending order of output. The workshops in the picture produce nine items, led by charcoal 160.6 (35.7%), clothing 123.0 (27.3%) and paper 58.6 (13.0%).
The legend shows up to ten items one per row; a facility with more than ten shows the top nine plus a grey "Others (N)" row for the rest. The first version (November 18) stopped at eight rows (the top seven plus Others); on November 21 this was widened to ten, so all nine workshop outputs now appear individually.
2. The panel keeps its shape when you switch facilitiesThe legend now uses the same type size and row height whatever the number of items. Previously the rows were squeezed only when there were many items, so the spacing changed each time you picked another facility. The row pitch is now set from the height of ten rows, so rows line up in the same places for a three-item facility and a nine-item one.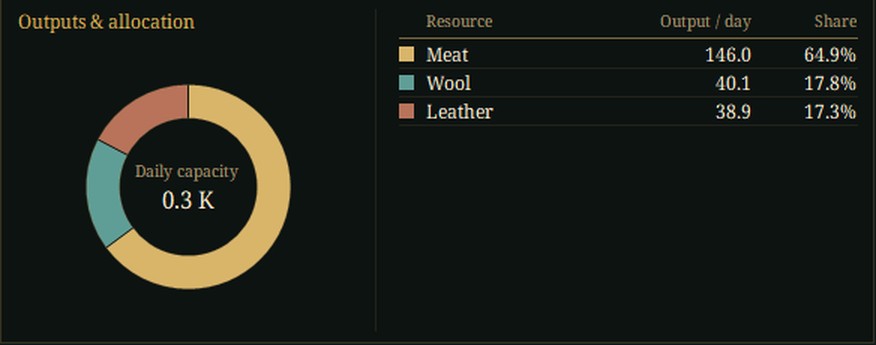
Ranch selected: three items, meat 146.0 (64.9%), wool 40.1 (17.8%) and leather 38.9 (17.3%), with a daily capacity of 0.3 K. The row spacing matches the nine-item workshop.
On November 20, the daily chart above it (Balance, Wage per worker, Workers) and this panel were given equal heights. Before, the chart had a fixed height and the panel below took whatever space was left; now the two panels split the left column evenly (231 pixels each in the verification run).
3. Slices and legend rows light up togetherOn November 21, slices and legend rows started highlighting as a pair. Hovering over a slice brightens it and puts a coloured band on the matching legend row. Hovering over a legend row does the same for that row and its slice.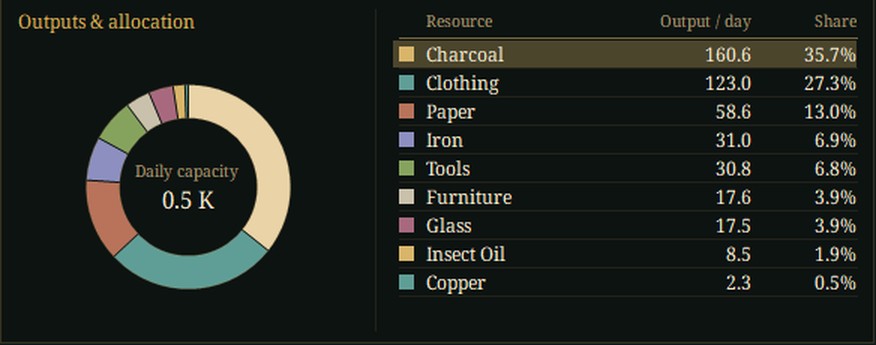
The mouse over the charcoal slice: the slice brightens and the charcoal row in the legend gets a band.
This matters most when a facility makes many items. Slices use seven colours based on the screen's gold, in order, so from the eighth item the colours repeat: for workshops, insect oil (8th) shares charcoal's colour and copper (9th) shares clothing's. Hovering shows which row a small slice belongs to. Only the ring itself responds; the hole in the middle and the area outside the ring highlight nothing.
What was checkedIn a Debug verification run, the capture checked the number of legend rows (nine for workshops), that the two panels have equal heights and fit inside the view, and the hit testing for slices and legend rows (the ring returns the first slice; the hole and outside return none) before taking the hover screenshots. The way legend rows are built is also covered by automated tests.
Not done yet- Because slice colours cycle through seven, a facility with eight or more items can show two slices of the same colour.
- On the English screen, long business names in the Management panel are cut off with an ellipsis (for example, Ravenwood Merchant Ho…).
The images are actual game screens taken on the morning of November 22 from a Debug build of main (eb0a38c), launched without showing a window. They start from the initial master data in a verification state; no user save was used. Because this is right after the start, the daily chart has no records yet and panels such as Sales show 0. The Japanese and English screens were captured by launching the game in each language. Images 2 and 3 enlarge the Outputs & allocation panel 1.5 times. Nation, place and business names come from the verification state.
The Facilities screen: DEVELOPMENT SNAPSHOT #104 — Facilities at a Nationwide Glance: One List, Queue Cards, Named Houses
Donut charts on the HUD: DEVELOPMENT SNAPSHOT #82 — Donuts on Both Sides: Rebuilding the Map HUD
Check the files currently available and the development status on the downloads page